Contour Lines in Vector Tiles
Contour lines are a key element in topographic maps, as they allow us to visualize the elevation of an area. In this tutorial, we will show you how to create contour lines from a digital elevation model (DEM) and display them using vector tiles.
Prerequisites
To follow this tutorial, you will need to have gdal installed on your
system. If you don't have it already, you can install it by running the
following command:
sudo apt-get install gdal-binDownloading the DEM Data
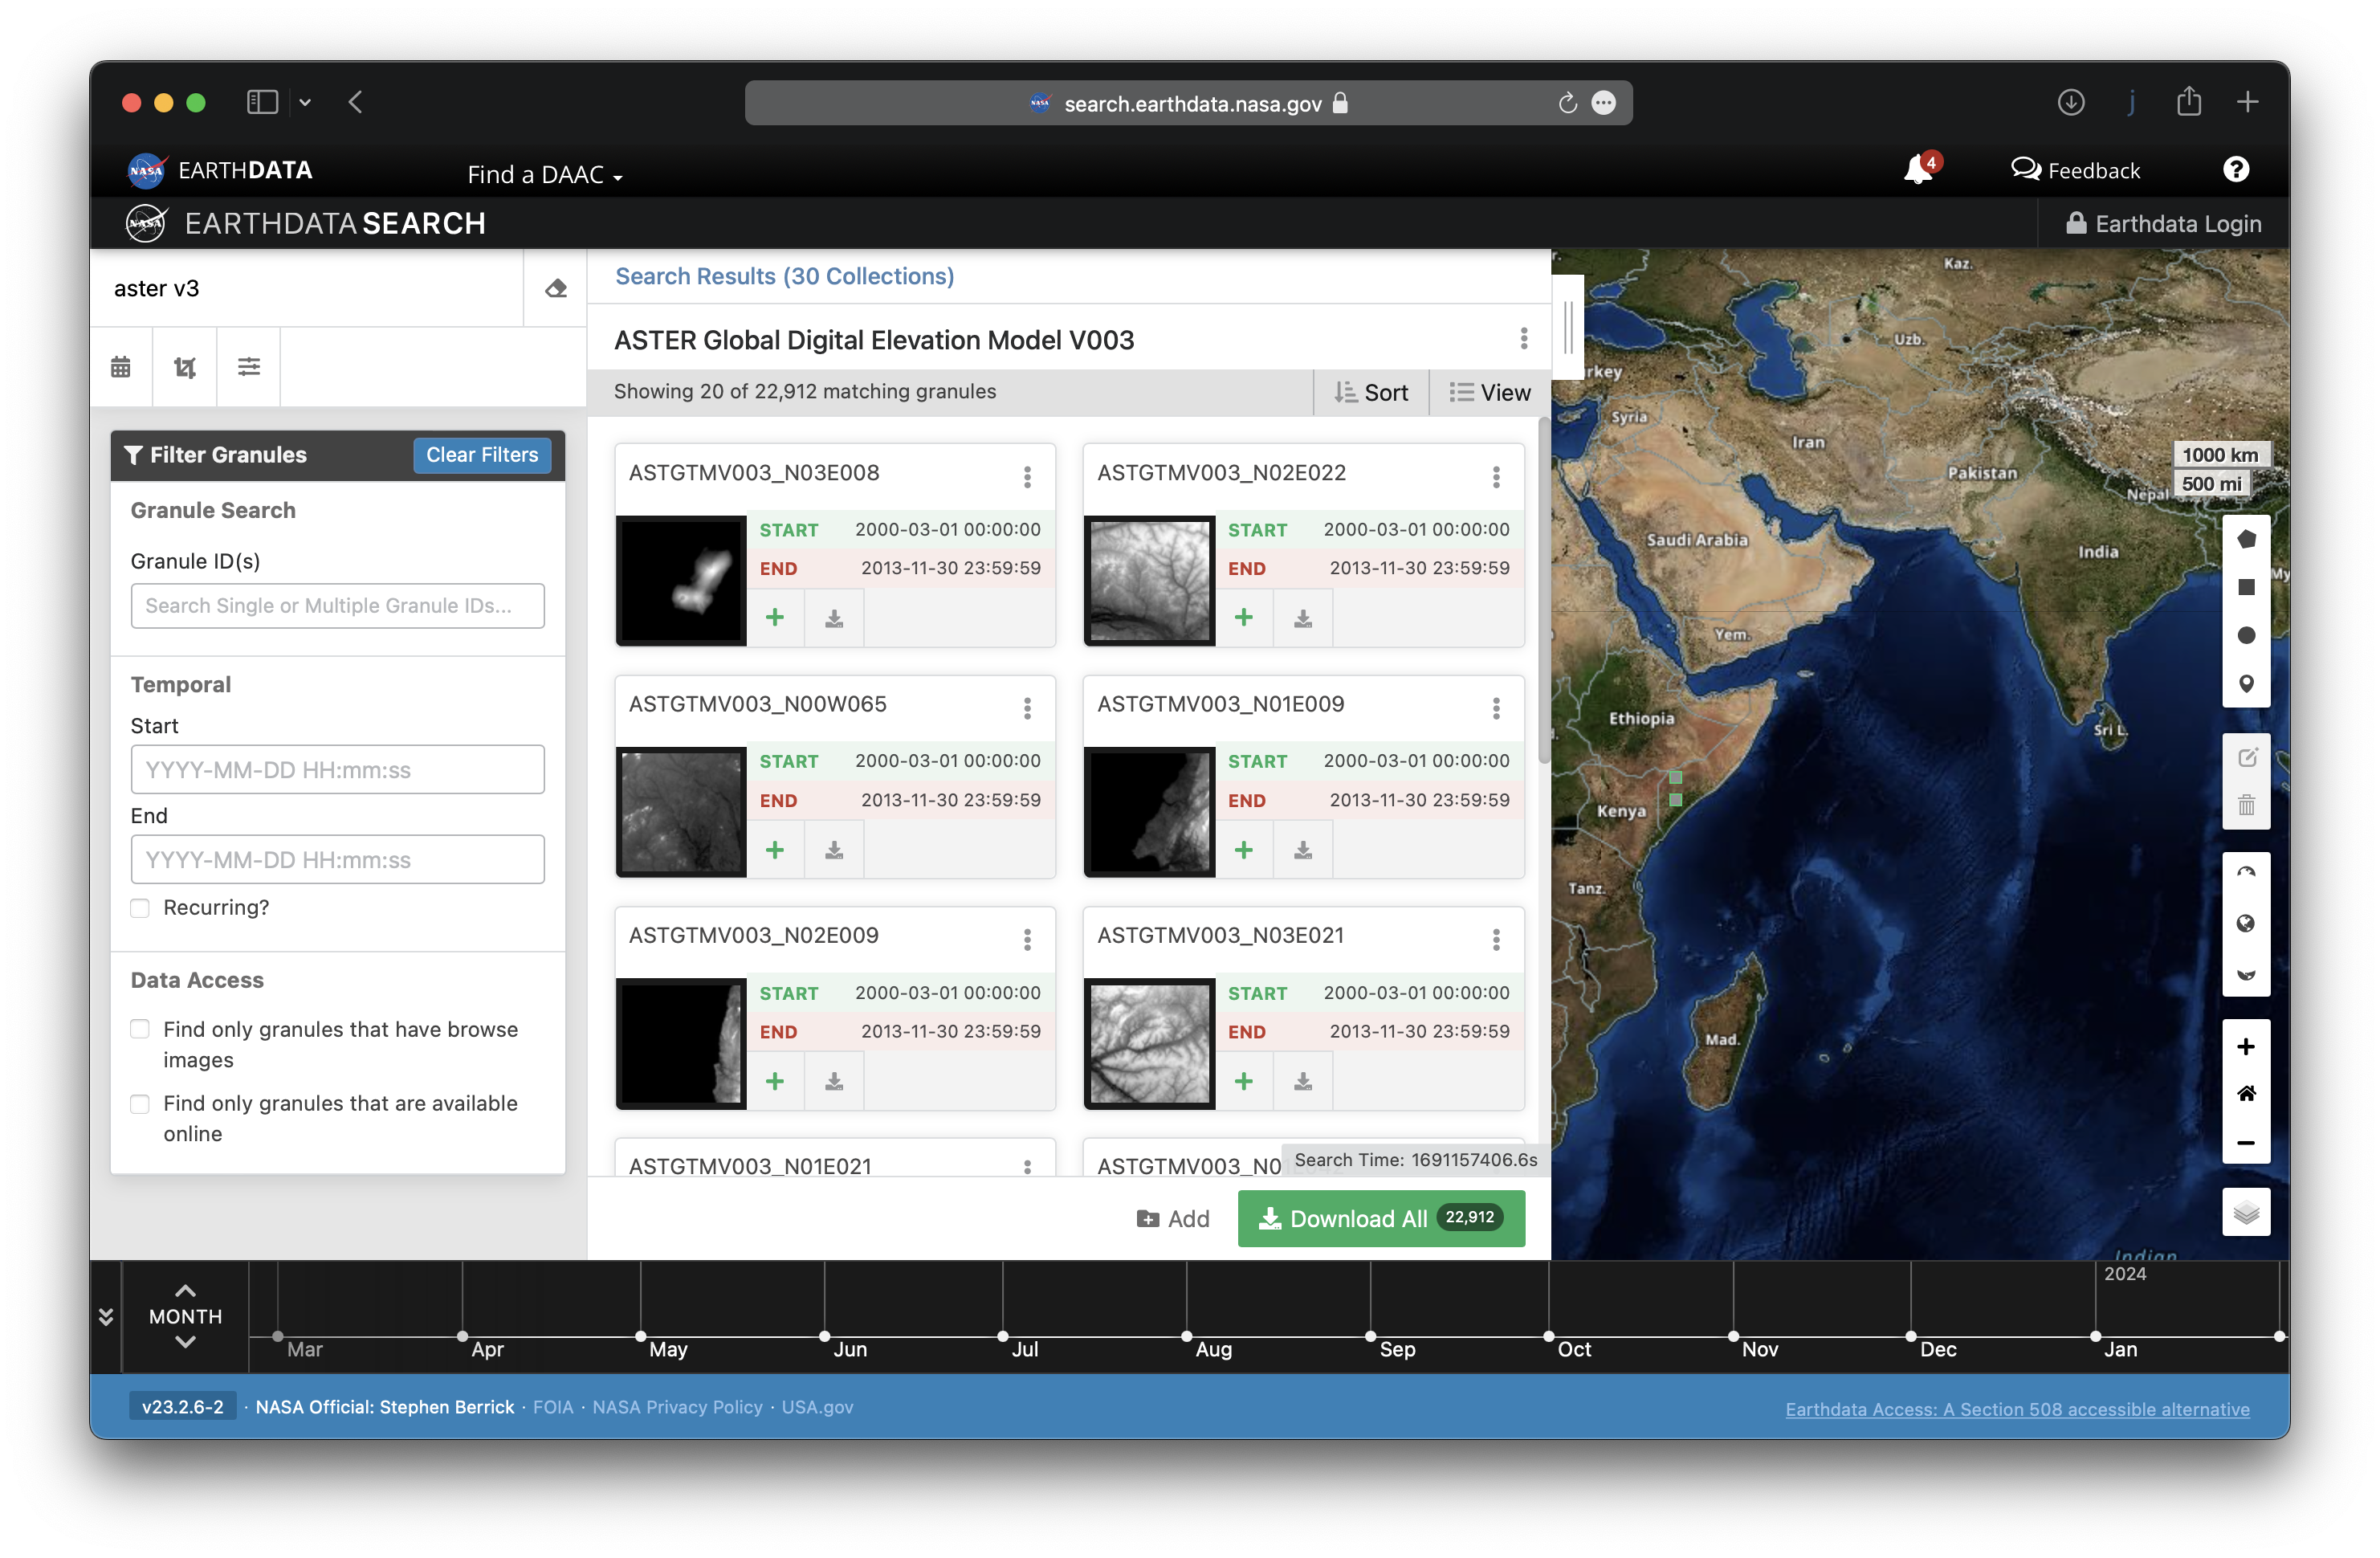
The first step is to download the DEM data. For this tutorial, we will be using the ASTER (opens in a new tab) dataset.
You can download it from the
NASA Earthdata (opens in a new tab)
website. You can either select the "granules" or click on the Download All
button to download the entire dataset.
Note: You will need to create a free account on NASA Earthdata to download the data.
Alternative Datasets
If you want to use a different DEM dataset, below is a list of some other options:
- SRTM (opens in a new tab)
- COPERNICUS-DEM (opens in a new tab) (note: contains quite some artifacts)
Reprojecting the GeoTiff
The geotiff file provided in this tutorial is already in the desired projection (WebMercator), but in case you want to use a different geotiff file, you can use the gdalwarp command to reproject it. Here's an example of how to do it:
gdalwarp -rc \
  -s_srs epsg:4326 -t_srs epsg:3857 \
  -dstnodata 0 -of GTiff -co tiled=yes \
  liecthenstein-aster-dem-v2.tif \
  liecthenstein-aster-dem-v2-3857.tif
Generating the Contour Lines
Now that we have the GeoTiff in the desired projection,
we can use the gdal_contour command to generate the contour lines.
The -a argument specifies the column that contains the elevation data,
the -i argument specifies the interval at which contours
should be generated (in this case, we are using 10 meters),
and the -nln argument names the table that will contain the data.
gdal_contour \
  -a elevation -nln aster_dem -i 10 \
  -f PostgreSQL \
  liecthenstein-aster-dem-v2-3857.tif "PG:host=localhost user=baremaps password=baremaps dbname=baremaps"
Improving Performance with Indexes
To improve the performance of the contour lines,
we can add some indexes to the database.
Here's an example of how to create a SPGIST index:
DROP INDEX IF EXISTS aster_dem_gix;
CREATE INDEX IF NOT EXISTS aster_dem_gix ON aster_dem USING SPGIST(wkb_geometry);
Displaying the Contour Lines
Finally, we can use Baremaps to display the contour lines in a web browser. To do this, run the following command:
baremaps map dev \
  --tileset 'tileset.json' \
  --style 'style.json'
This will start the tile server and automatically reload the configuration files when you make changes. You can then preview the map in your web browser.
Optional: Smoothing the Contour Lines
If you want to improve the rendering of the contour lines, you can use a smoothing function like ST_ChaikinSmoothing. This function takes a geometry as input and returns a smoothed version of that geometry. Here's an example of how you could use it:
UPDATE aster_dem
SET wkb_geometry = ST_ChaikinSmoothing(wkb_geometry, 0.1)
Keep in mind that this step is optional and might not be necessary depending on the quality of your input data. You can experiment with different smoothing parameters to find the best balance between smoothness and preservation of original features.
That's it! You now know how to generate and display contour lines from a digital elevation model using vector tiles. Happy mapping!